Stock Forecasting
Sentiment Analysis & 7-Day S&P 500 Forecast
About this project
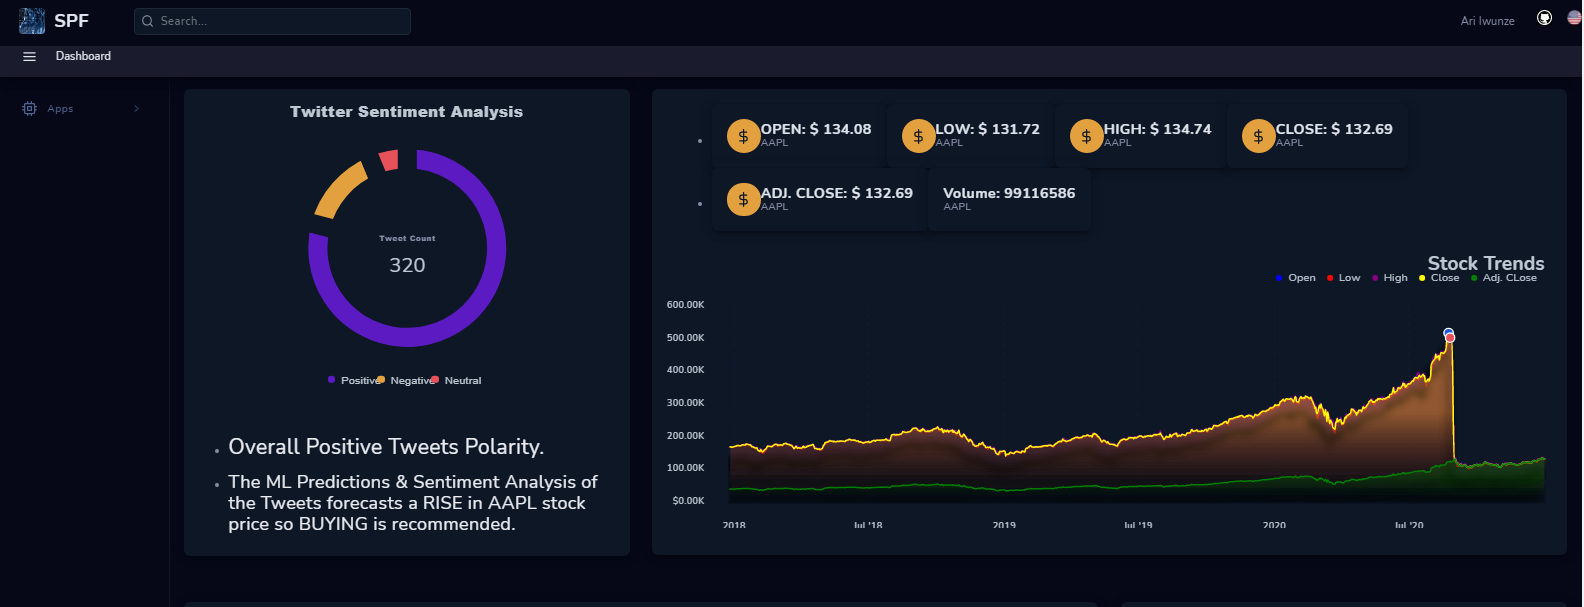
A web app built to visualize the sentiment analysis of tweets, data trends, and the 7 days forecast of the S&P 500 companies. The purpose of this research is to build a model that can efficiently predict a company’s Adj. Close price for the next 7 days.
Key features
- 01Used Apple’s historical stock data extracted from Yahoo Finance.
- 02Tested for stationarity using the Augmented Dickey-Fuller Test.
- 03Used ACF and PACF plots to determine the p and q ARIMA input parameters.
- 04Validated the model on holdout data with RMSE of 2.5.
Methodology & results
Purpose
The goal is a model that can efficiently predict a company’s adjusted close price for the next seven trading days. The working instrument is Apple (AAPL), pulled directly from Yahoo Finance. Twelve features come with the download, but only one matters here: Adj. Close. Everything else — volume, splits, high, low — is set aside so the model can be judged on the single quantity a portfolio actually cares about.
Testing for stationarity
Stock prices are almost never stationary. The mean drifts up over time, the variance widens with volatility regimes, and a model that assumes constant statistics quickly degrades. Before fitting any ARIMA the series has to be tested. The Augmented Dickey-Fuller (ADF) test does exactly that: it evaluates whether a unit root is present, i.e. whether the series is non-stationary.
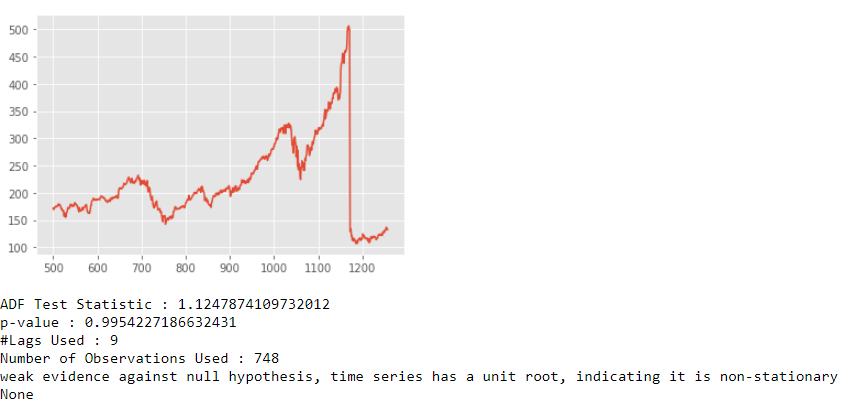
With the raw series confirmed non-stationary, standard practice is to difference the series (subtract each observation from the previous one) and re-test. First-order differencing typically detrends a random-walk-like price series enough for ADF to reject the null.
Choosing p and q
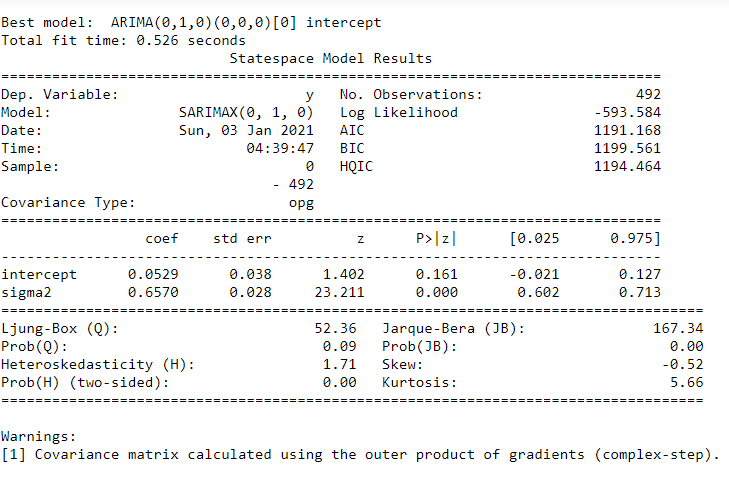
With d = 1pinned by the differencing step, the remaining ARIMA parameters — the autoregressive order p and the moving-average order q— are read off the ACF and PACF plots. Eyeballing the plots suggested p = 1, q = 2, but running auto_arimagave a cleaner answer: both parameters collapse to zero. The final model is effectively an ARIMA(0,1,0), a random walk with drift — a modest but honest baseline for a seven-day horizon.
Results
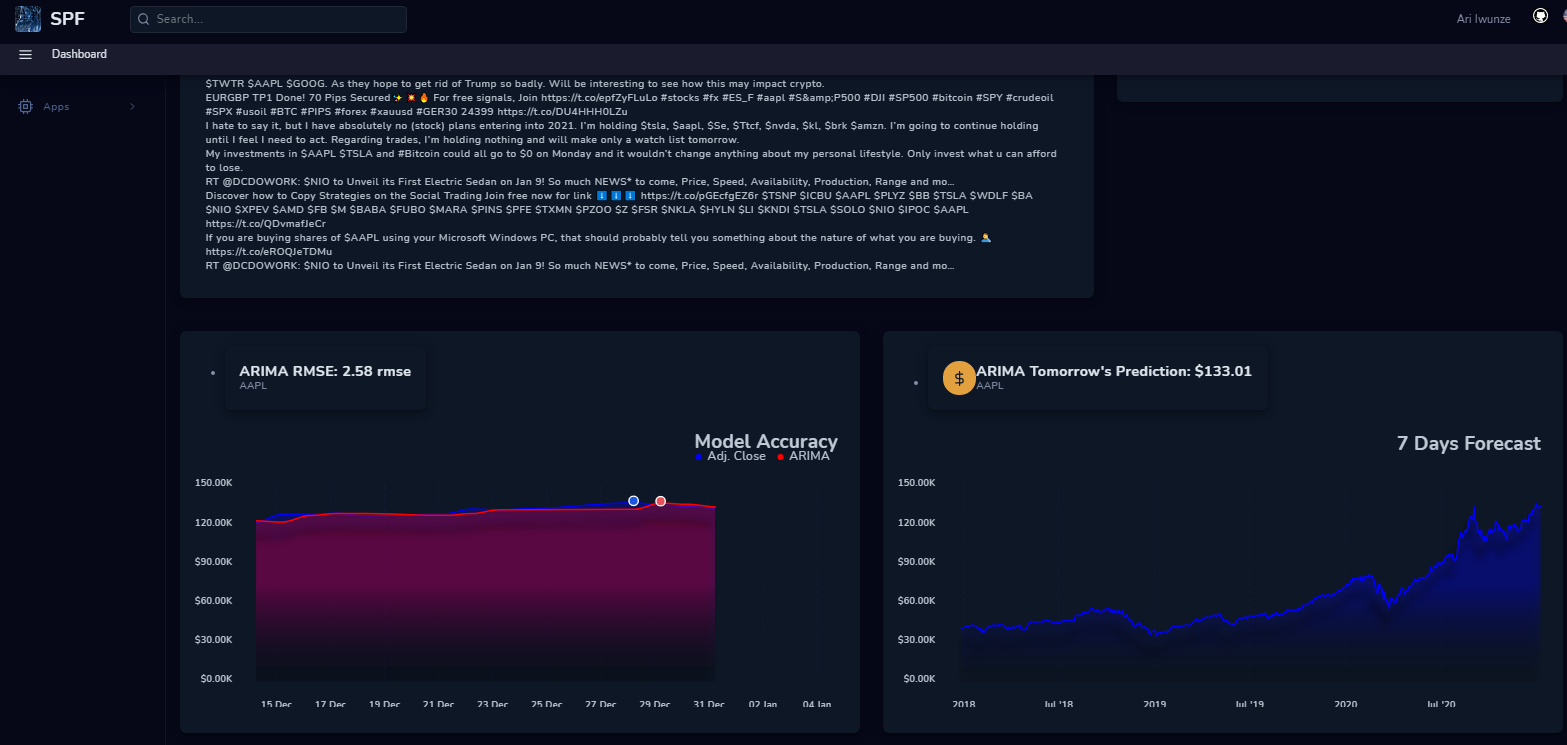
The model was trained on the first half of the series and validated on held-out data. RMSE came in at 2.5on the validation window. For a naive univariate forecaster on a stock as noisy as AAPL, that’s a defensible baseline — and, importantly, a clean reference point for evaluating LSTM or multivariate models later.
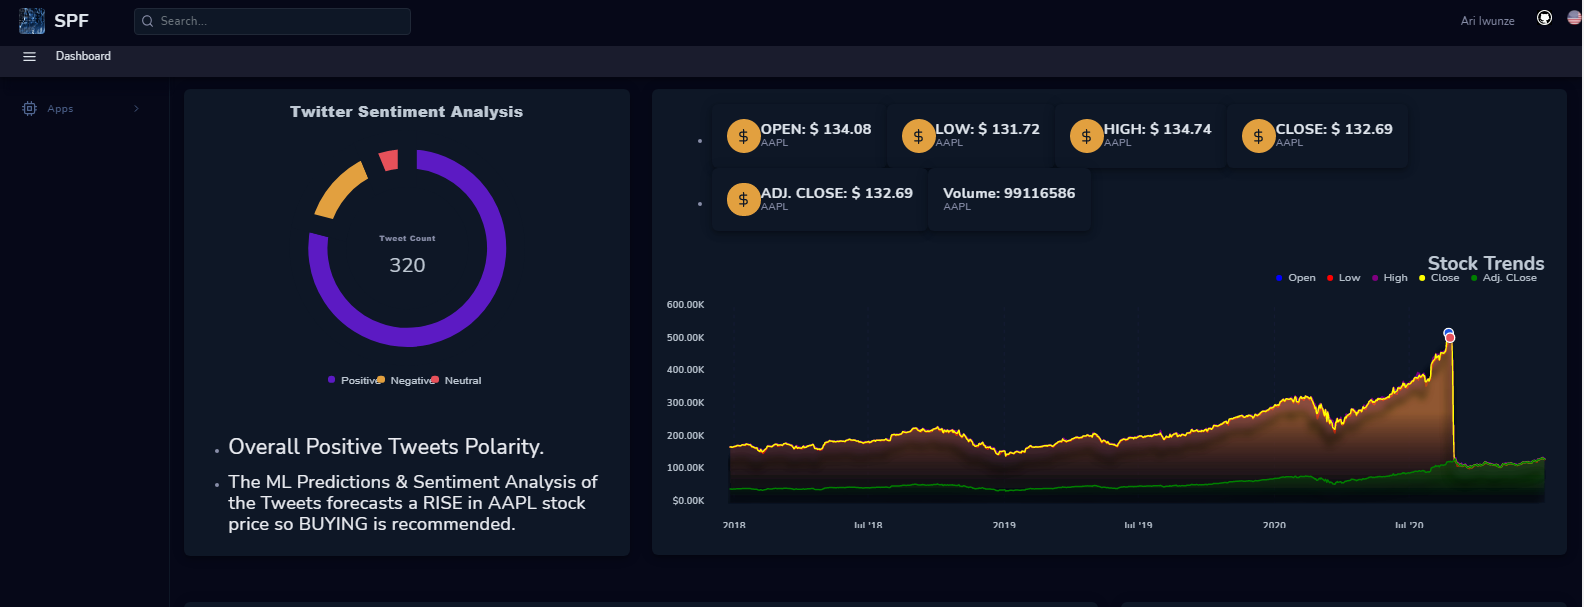
Recommendation and future work
For AAPL specifically, (0, 1, 0)is the recommended starting point — but always confirm via auto_arima before committing to a mix. Two extensions are worth chasing:
- A single-variable LSTM on the same Adj. Close series, to see whether non-linear temporal structure improves RMSE at seven days.
- A multivariate LSTM that folds in volume and volatility features — the sort of cross-signal a linear ARIMA cannot exploit.