About this project
A simple web app that helps identify the cause of an accident using the XGBoost machine learning algorithm. The goal is to analyze Chicago car accident reports in order to classify the primary cause of an accident.
Key features
- 01Q1: What is the distribution of car accident causes?
- 02Q2: Which regions have the most car accidents?
- 03Q3: What effect do external factors have on the amount of car crashes and car crashes with injuries?
- 04Random Forest, XGBoost & LinearSVC classifiers were implemented after re-sampling with SMOTE since the dataset was heavily imbalanced.
- 05XGBoost with PCA feature selection was selected as the final model.
Methodology & results
Purpose
The goal is to analyse the City of Chicago’s car-accident reports and classify the primary cause of each collision. Three questions frame the study:
- Q1. What is the distribution of car-accident causes?
- Q2. Which regions see the most car accidents?
- Q3.What effect do external factors — time of day, weather — have on total crash volume and on crashes with injuries?
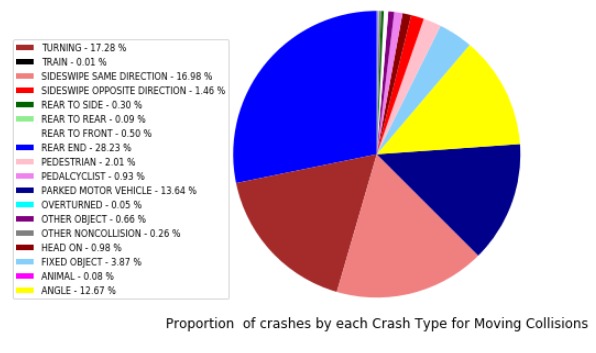
What the distribution says
The single most common crash type in Chicago is rear-end at 30%, followed by sideswipe (same direction) at 16%. Those two categories dominate the volume column — but volume and severity are different questions. When the crashes are re-ranked by fatality rate, turning collisions come out on top at 19%, followed by angle impacts at 13%. Any intervention that changes fatality outcomes should target the second list, not the first.
Recommendation
The near-term policy lever is straightforward: install dedicated turning phases at the intersections most implicated in the turning and angle categories. Separating turning flows from through-traffic signals is the single-highest-leverage change against the crash types that account for the most fatalities.
Model
The primary-cause label is highly imbalanced across categories, so the training set was first resampled with SMOTE (Synthetic Minority Over-sampling Technique) to give the classifier a fighting chance on the rare classes. Three baselines were trained on the resampled data:
- Random Forest
- XGBoost
- Linear SVC
All three landed within about 5% of each other on held-out accuracy. XGBoost was selected as the final model, and PCA was used for feature selection to keep the pipeline compact and reduce variance from correlated inputs. The feature vector that survived selection covers driver behaviour, vehicle configuration, and environmental conditions:
- Driver’s action
- Driver’s vision
- Roadway surface condition
- Traffic control device condition
- First crash type
- Posted speed limit
- Driver age
- Driver physical condition
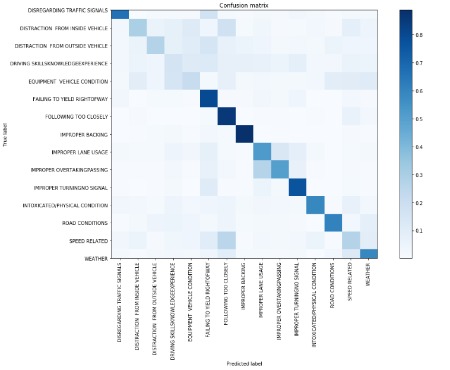
Results
The final model returned a log loss of 12.5 and 64%accuracy on the held-out set — the amount of primary-cause labels the classifier picked correctly out of every hundred. Total recall and total precision both landed at 64%. The balance between the two suggests the model is neither over-committing nor under-committing to any single category — it fails roughly evenly across the confusion matrix rather than collapsing predictions onto the majority class.
Sixty-four percent is not a diagnostic model, but it is a defensible first cut on a genuinely difficult multi-class problem: crash cause labels in police reports are inherently noisy, and the ceiling on any classifier trained on that ground truth is bounded by the ceiling on the labels themselves.
Future work
- Road-type division. Segregate collisions by street class (arterial, residential, expressway) so the causal factors on each surface can be modelled separately.
- More features.Extend the input vector with driver-side signals the current dataset omits — whether the driver was on the phone, whether they exceeded the posted speed, years of driving experience.
- Region division. Split Chicago into North, South, East, West, and Central and fit region-specific classifiers to surface geographic patterns the global model averages out.